Groundwater risk, scored at the district level, with a margin you can underwrite against.
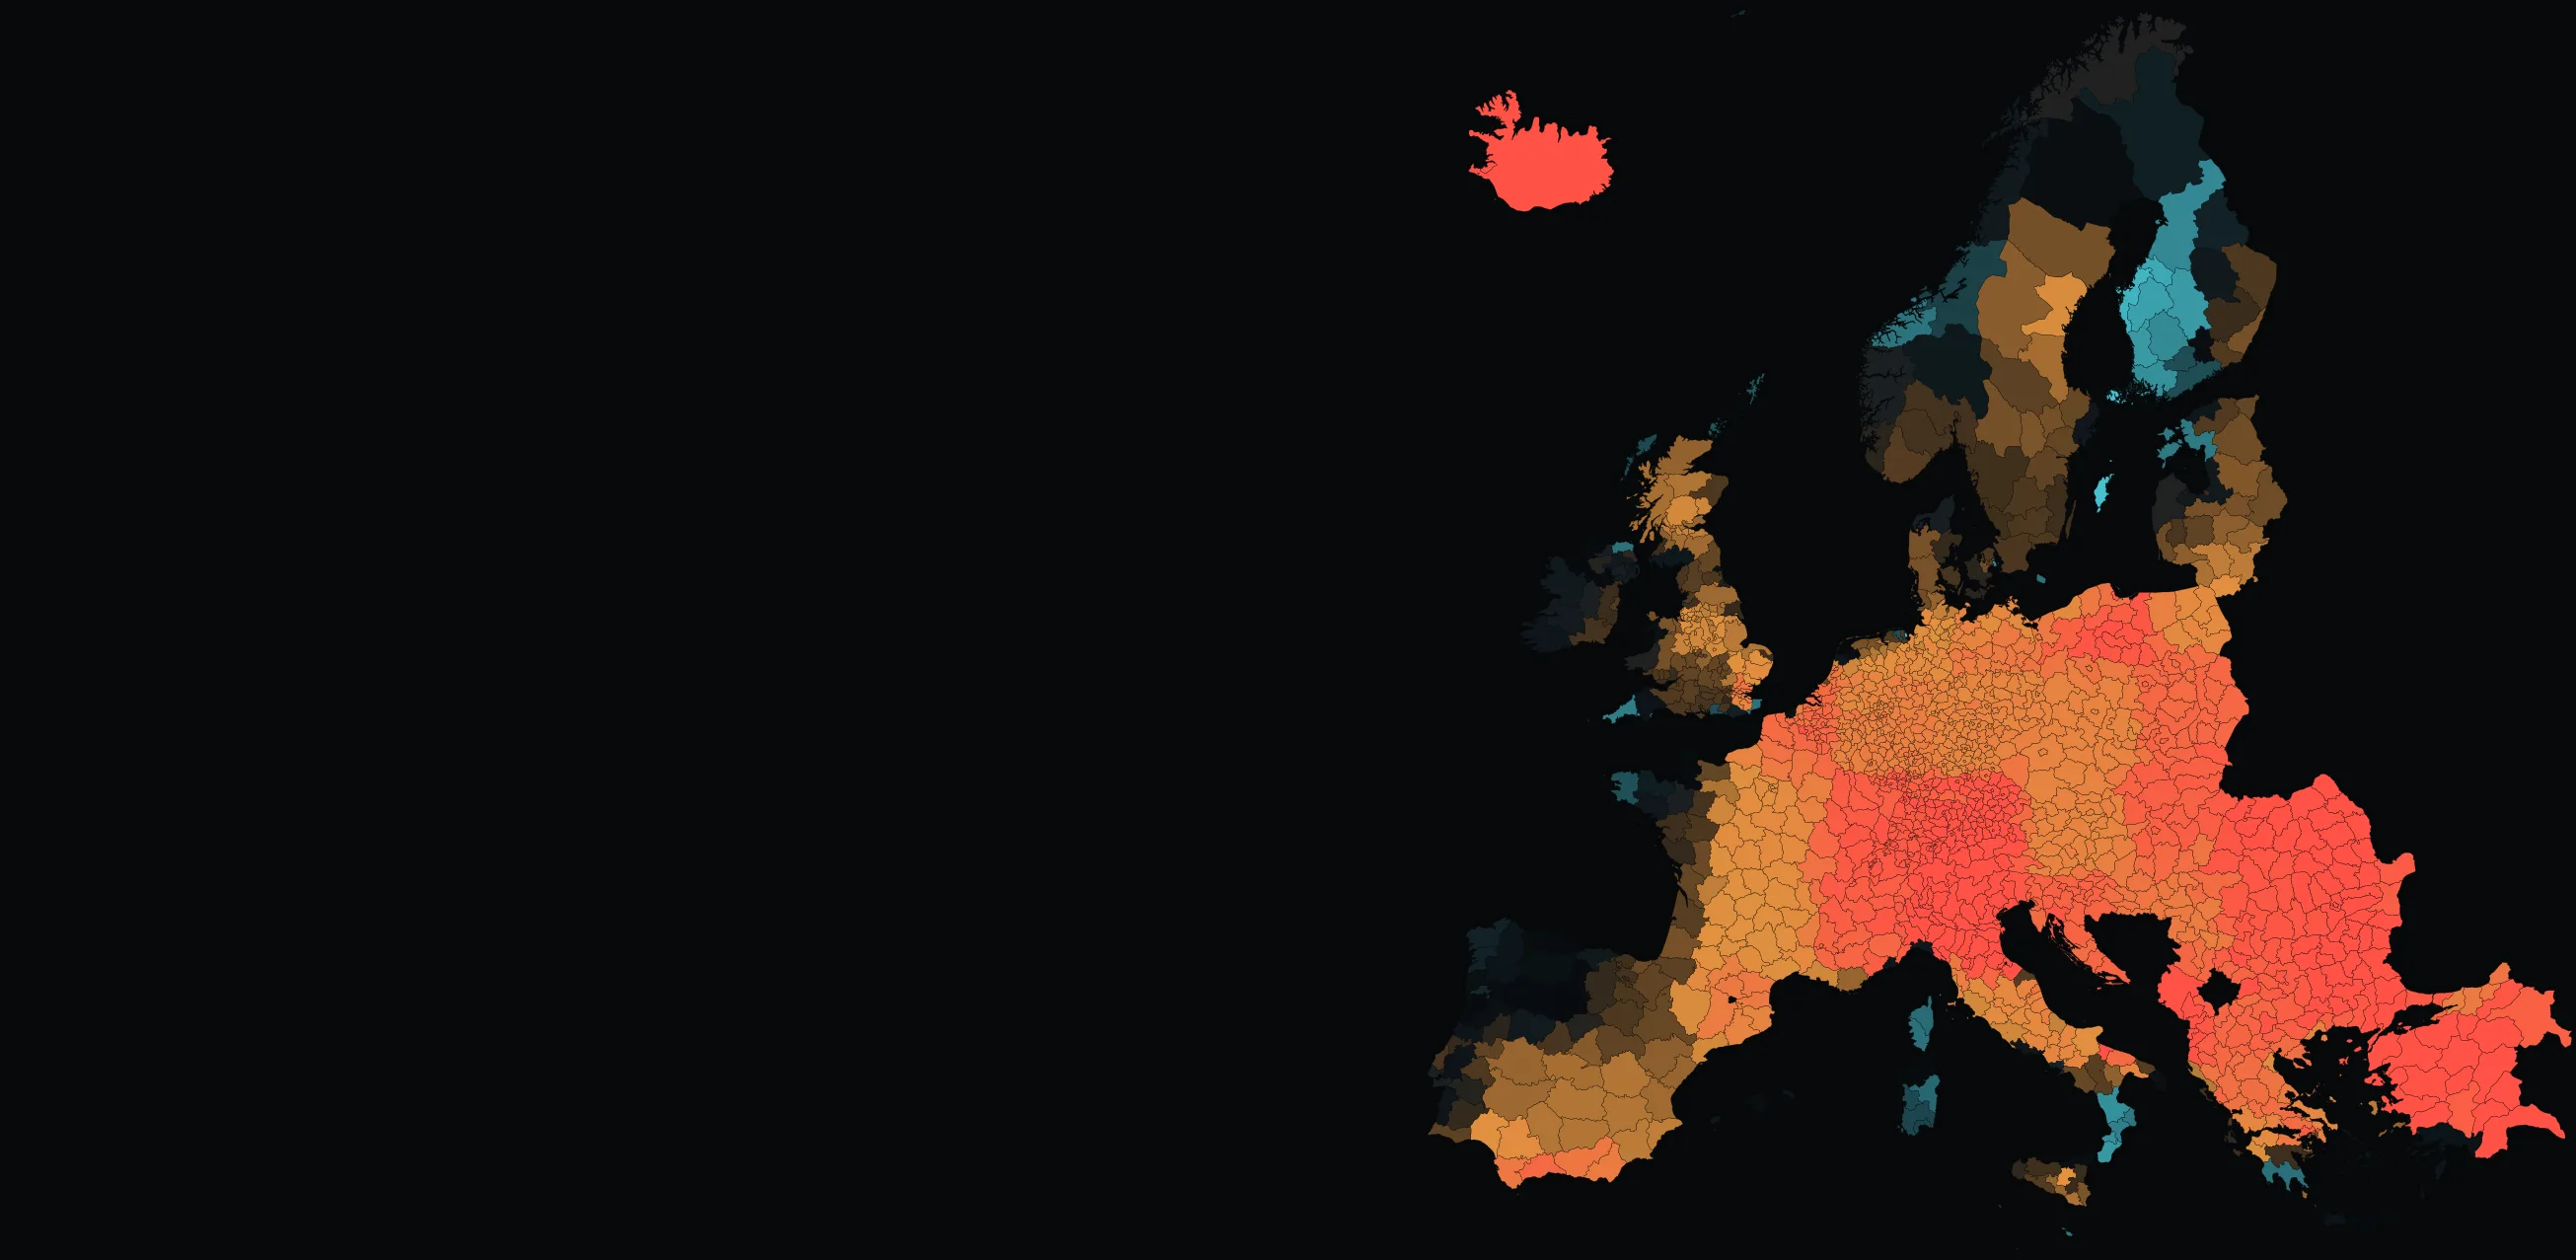
From orbit we weigh the water stored beneath an entire region. The trouble is resolution: that raw signal is far too coarse for a single portfolio, loan book or abstraction licence to act on. Our engine brings it down to the administrative-district (LAU) level and ships every value with a quantified uncertainty band, so the number arrives ready for pricing, scoring and disclosure rather than sitting in a research paper.
A per-district groundwater-trend indicator, each one carrying a calibrated prediction interval and a documented comparison against independent monitoring wells. It's the structural water signal that a rainfall record or a single-day satellite image simply can't give you.
The questions a buyer asks: answered straight.
Everything below describes what the product does and how it is checked. It does not quote a measured accuracy figure: every output instead carries its own quantified, validated uncertainty.
How good is it, and how would I know?
We don't lead with a single accuracy percentage. Instead, every district value is delivered as a calibrated prediction interval built with conformal methods, so the band carries a guaranteed coverage rate, when we say a value sits inside its interval with a stated probability, that frequency actually holds out of sample. So you underwrite against the margin, not against a point estimate you're asked to trust blindly.
- Independent reference. Downscaled water-storage trends are benchmarked against national geological-survey monitoring-well networks, district by district.
- Honest failure mode. A district that fails the agreement check is flagged "insufficient agreement" and is not scored: rather than shipped with a flattering number.
- Continuous, not one-off. The benchmark is re-run with each new data release and ships as a validation pack, kept current for the life of the contract.
How fine, how often?
Spatial: delivered at administrative-district (LAU) resolution, downscaled from a native orbital footprint that spans hundreds of kilometres.
Temporal: refreshed on the cadence of the underlying orbital signal, a new measurement each cycle, with no fabricated values invented between releases.
How does it reach my systems?
- API: district indicator plus interval, queried by code or region ID.
- GeoTIFF: georeferenced raster for direct load into GIS.
- PDF report: portfolio or district brief for committee and disclosure files.
- Ready-to-read map layers: for analysts who do not run a GIS; files and API, not a portal.
Vector and raster exports import into standard GIS and risk platforms. Tabular feeds map onto existing scoring pipelines.
Where the method is weak, and what we do about it
The native orbital footprint is coarse. A single raw cell can span an area the size of half a country, and we don't pretend otherwise: the downscaling step is physically constrained and reports its own uncertainty, so a district interpolated from a sparse signal carries a visibly wider band than one anchored by dense ground reference. Districts where the signal can't be resolved with confidence get flagged instead of silently filled in.
From orbit what we're actually reading is the change in water mass itself, and on its own that can't separate deep aquifer change from soil and surface water. We mitigate this by combining it with independent surface-balance signals and calibrating against monitoring wells, which lets the delivered indicator isolate the structural groundwater component rather than reporting a raw mass total.
Where it fits disclosure
Outputs are designed to support CSRD and EU Taxonomy water-risk disclosure with an auditable chain from signal to figure. Processing and delivery run under EU data residency.
What we claim is relevance, not certification. We don't hold a regulatory seal, and we say so plainly. The validation pack is built so your auditors can replay any figure we issue.
What you actually receive
- API endpoint with value + interval + validation flag
- GeoTIFF raster layers
- Vector district tables (CSV / GeoPackage)
- PDF portfolio and per-district briefs
- API and map-layer access
What time frame the indicator speaks to
This is a structural trend product, not a short-horizon forecast. It quantifies the multi-year slope of water storage, how fast reserves are gaining or draining once the season is removed, along with the statistical significance of that slope. A multi-year loan, a renewing treaty, a long-lived abstraction licence: that slope is exactly what each of them is exposed to.
One table for the procurement file.
| ATTRIBUTE | GROUNDWATER INTELLIGENCE |
|---|---|
| Primary client | Reinsurers, agri-banks and mortgage lenders, water utilities, CSRD reporting corporates |
| Spatial resolution | Administrative district (LAU), downscaled from the regional orbital signal |
| Update frequency | Each orbital release cycle; no values invented between releases |
| Uncertainty | Calibrated prediction interval (conformal, guaranteed coverage) on every value |
| Validation reference | National geological-survey monitoring-well networks |
| Delivery | API · GeoTIFF · vector tables · PDF report · API & map layers |
| Integration | Imports into standard GIS and risk-scoring pipelines |
| Horizon | Multi-year structural trend with significance, not a short-range forecast |
| Compliance relevance | CSRD / EU Taxonomy water-risk disclosure; EU data residency |
| Data room | Full methodology and source list under NDA |
What this product does not do.
- It is not a well-by-well gauge. It is a district indicator calibrated by wells, not a replacement for a piezometer on a specific plot.
- Sparse-reference districts carry wider intervals. Where ground monitoring is thin, the band widens honestly rather than the estimate being overstated.
- It is not a weather or seasonal forecast. It reports structural trend, not next month's water table.
- No trained-model accuracy headline is claimed here. The product's guarantee is calibrated coverage of its intervals, validated against independent networks.
Evidence, when the pilot closes.
District groundwater pilot
This slot is reserved for a completed design-partner pilot. We don't publish a case study before the work exists, when one closes, this section will carry the client context, the validation result against that client's own reference data, and the realised interval coverage, with figures any auditor can replay.
Request the validation pack.
Full methodology, per-district correlation tables and the interval-coverage protocol ship under NDA with every pilot, and stay current for the life of the contract.
Start a pilot See how we validate