IN THIS BRIEFING
Why a wet year no longer fixes it
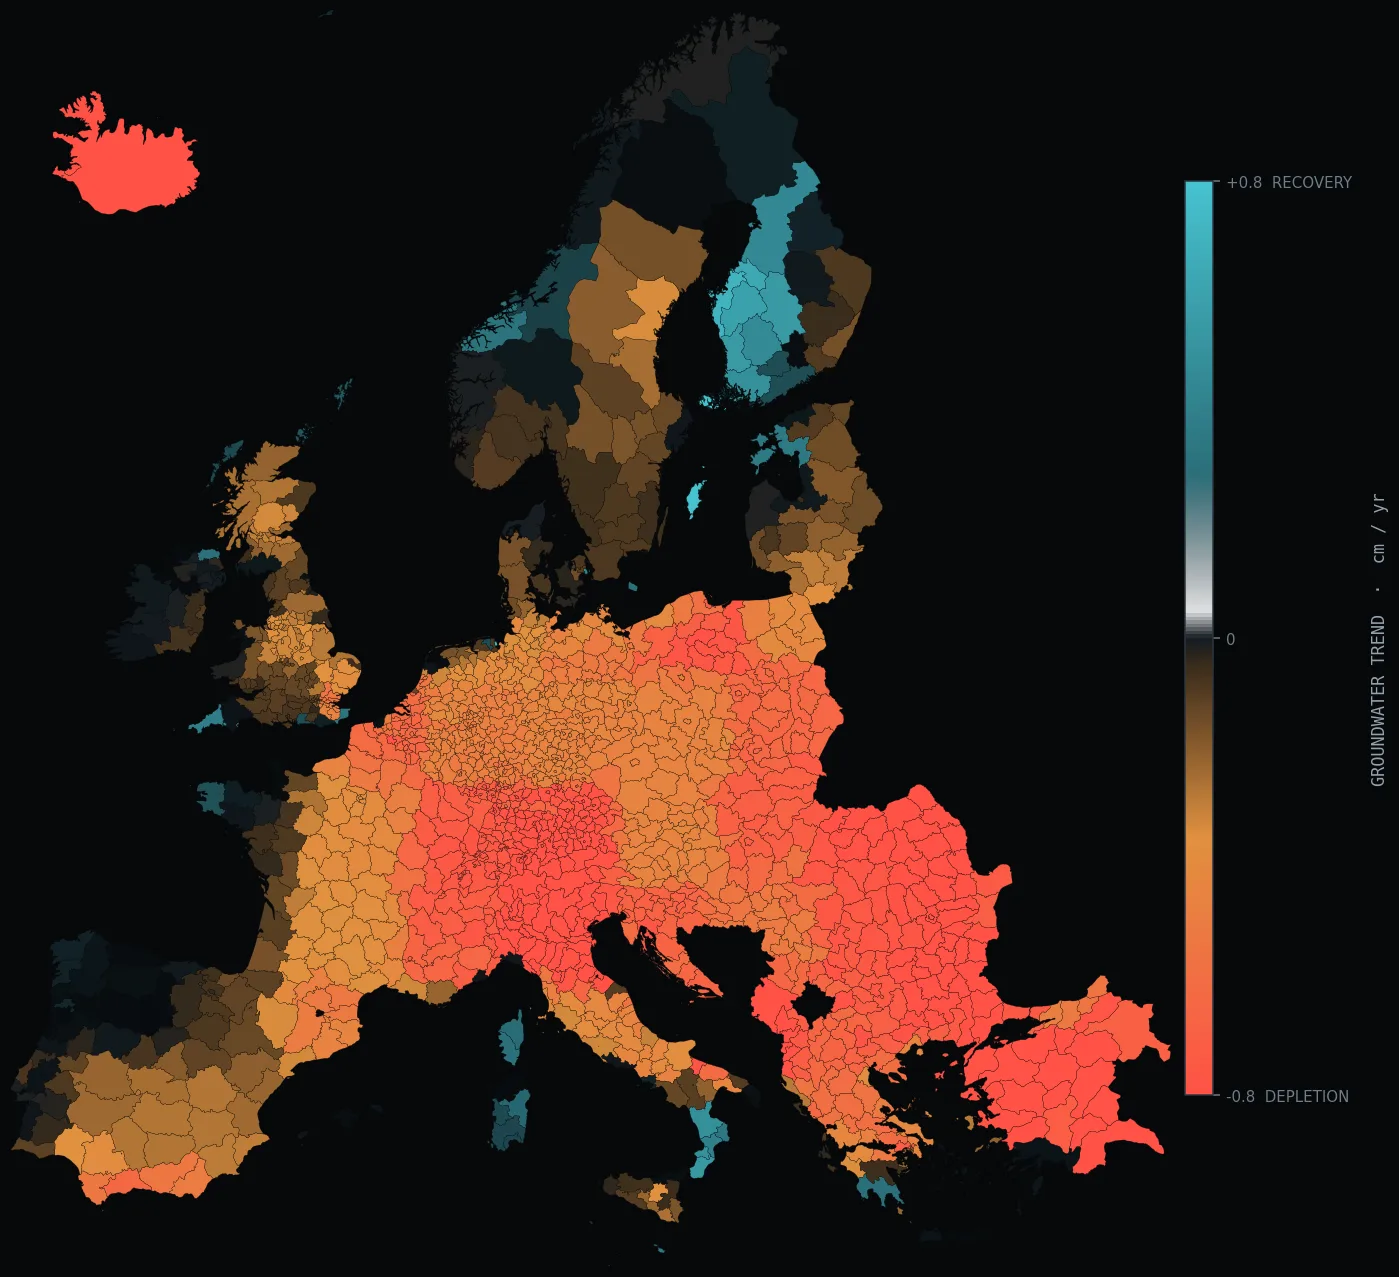
Drought, as most people picture it, is a dry summer: cracked soil, a thin harvest, low rivers, then rain, and recovery. The drying now spreading across parts of Europe is a different thing, and a more dangerous one, because it does not end when the rain returns.
Most of the continent's fresh water is not in its rivers but beneath them, in aquifers — the slow, deep stores that a well draws on and a dry month never touches. Think of them as a savings account. For years across central and southern Europe more has been withdrawn each season than has seeped back in, and the balance has begun to fall. A single wet winter refills the soil and lifts the rivers; the news moves on; the account below keeps emptying.
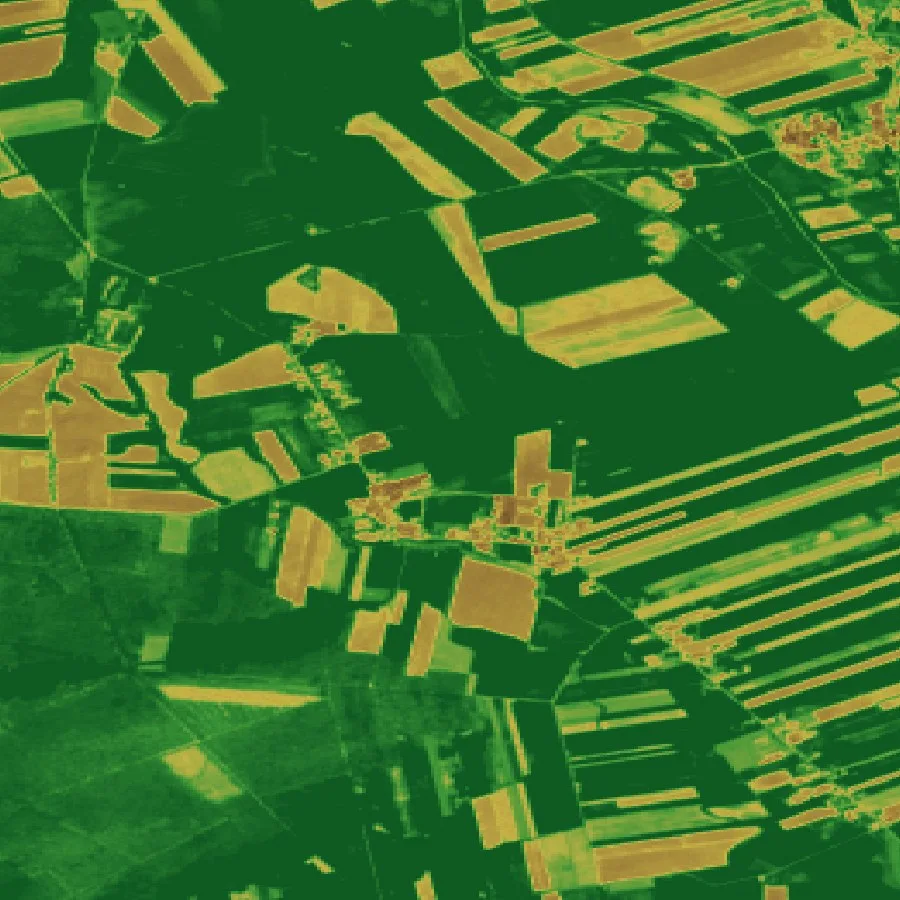
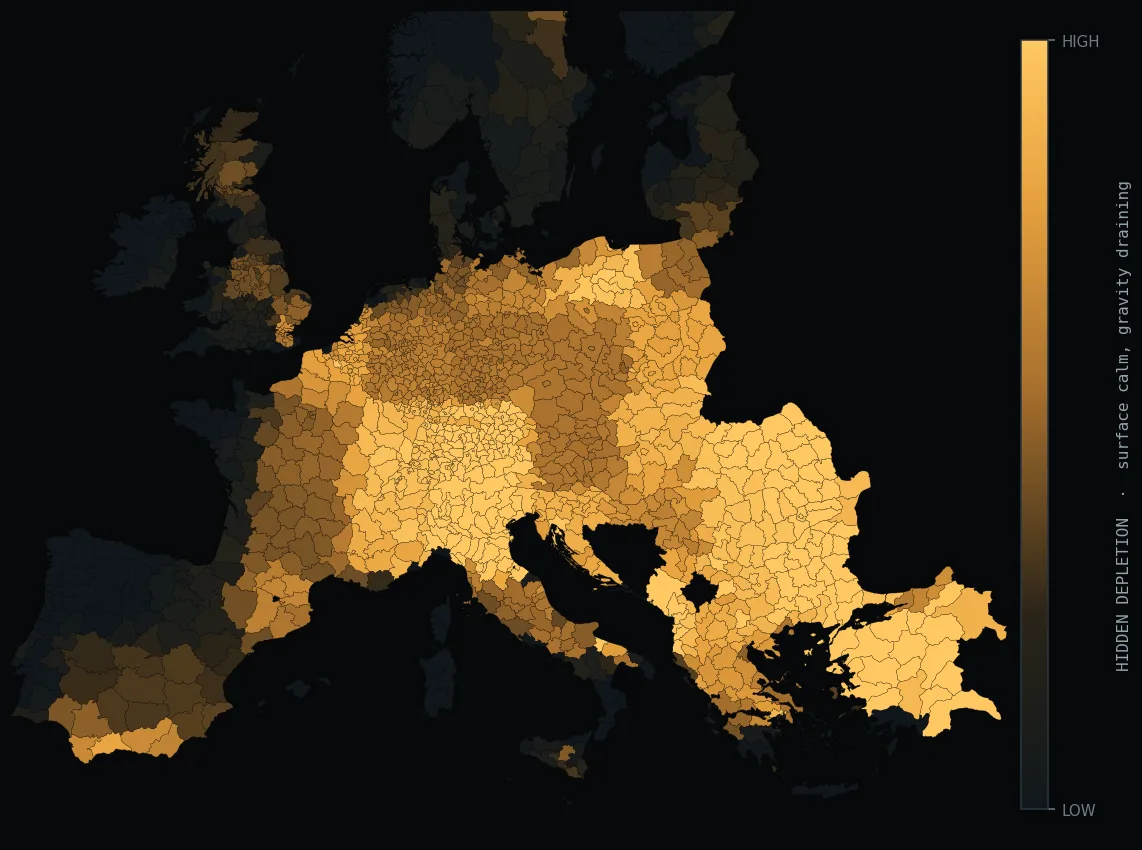
That is what makes the loss so easy to miss. The surface can look entirely healthy — green fields, flowing streams — while the reserve underneath drains away. By the time a well runs short or a river fails in high summer, the decline has been under way for years, invisible to anyone standing on the ground.

How underground water is read from space
You cannot photograph groundwater. It sits under soil and rock, hidden from any ordinary satellite image. But water has weight, and weight can be felt from orbit. As the amount of water held under a region rises or falls, it leaves a faint trace that instruments in space can track, month after month, across an area the size of a province.
Strip away the other things that move with the seasons — ice, snow, the swelling and shrinking of rivers — and what remains is a running tally of the total water stored in the ground, the deep aquifers included. It is not a snapshot of a single day, like a rain gauge or a photograph. It is a balance, summed over years, and it is read independently of cloud, rainfall and the colour of the crop. That independence is the point: it cannot be talked out of by one rainy week.
From a continental blur to a single district
There is a catch, and it is resolution. Read straight from orbit, the signal is coarse: a single measurement smears across an area the size of half of Poland. A map at that scale can tell you a continent is drying. It cannot tell a mayor whether her town's wells are at risk, or a lender whether one particular farm sits over a falling water table.
Closing that gap is the harder, less glamorous half of the work — bringing a blur the size of a region down to the level of a single district. It means teaching the coarse signal the local detail it lacks: the lie of the land, the soils, the rainfall, the way water actually moves in that place. Done carefully, and only as far as the evidence allows, it turns a headline into a figure a decision can rest on: not "Europe is drying", but "this district is losing water at this rate, and here is how sure we are".
Why the maps can be trusted
A map is only as good as the checking behind it. Each district's trend is set against independent measurements on the ground — wells and boreholes that sample the water directly — and against the surface water balance of rain, evaporation and soil. Every figure carries a stated margin of error. Where the data is thin, or the checks disagree, the district is flagged rather than quietly filled in.
The discipline is plain and unfashionable: publish the uncertainty, and say "we do not know" when that is the honest answer. It also explains why the view from orbit is worth the trouble, because no single older method sees the whole picture.
| METHOD | WHAT IT SEES | DEEP WATER? | MULTI-YEAR TREND? |
|---|---|---|---|
| A well or borehole | the level at one point | yes, but only there | only where it stands |
| A weather model | rain and temperature | no | a forecast, not a reserve |
| A satellite photograph | plants at the surface | no | a season, not a decade |
| The view from orbit, brought to district level | total water, deep stores included | yes, across the whole area | two decades, continuous |

What it changes
A falling aquifer is not only an environmental story; it quietly rewrites value. Farmland over a draining water table will, in time, yield less and cost more to irrigate — a fact that belongs in its price, and in the risk on any loan secured against it. A city long comfortable on its groundwater may have fewer years of margin than its budgets assume. A planner zoning new housing, an insurer pricing a dry season, a utility deciding where to sink the next intake — each is making a bet on water they have, until now, been unable to see.
None of this changes the weather. What changes is who can see the loss while there is still time to act on it. Measured early, a slow drought is a problem to be managed; noticed late, it is an emergency. The value of weighing the water is simply that: it moves the moment of knowing forward, from the year the well runs dry to the decade before it does.
FOR CITATION
A drought passes; this does not. The map shows a multi-year loss of stored water, read independently of the weather — a trend, not a season.
The danger hides in plain sight. The places that look healthy from the road or from a satellite photo can be the ones emptying fastest underground.
It lands on a desk, not a continent. The signal is brought down to the level of a single district, given an honest margin of error, and refreshed each month.