ORBISPECT

Black Sea Grain Watch: as the Bosphorus thins, Russia's Kerch gate swells at least +52%.

The Black Sea carries roughly 30% of world wheat trade. The Bosphorus currently passes about 83–84/day (-12% vs 2023), while Russia's Azov gateway — the Kerch Strait — has grown to about 12/day. Satellites see both the vessels and the fields the grain comes from.

BRIEFINGAS OF 2026-06-30WEEKLY CADENCEANALYSIS DESK: ORBISPECTv1.2

KEY JUDGMENTS

  1. The Black Sea export map is shifting east, structurally. Bosphorus transits run about 12% below 2023 while the Kerch/Azov gateway is roughly half again as busy — a sustained rerouting, not a seasonal dip.
  2. This is a logistics signal, not a cargo manifest. We see the vessels move; what they carry — cargo type, tonnage, origin — we do not. The Azov rise fits a rerouting of Russian logistics, but fitting is not proving.
  3. The producing fields stay readable where the official books go dark. Satellite-derived crop layers keep measuring Ukrainian plantings oblast-by-oblast — a yield signal independent of wartime statistics.
  4. Outlook — the eastward shift holds through Q3 2026. If the trend persists, the Azov share of Black Sea movement keeps rising into Q3; a reversal would need a Bosphorus-corridor restoration or an Azov disruption — both visible early in the weekly count.
Two independent layers converge here: vessel-movement analytics over the straits, and satellite-derived crop layers over the producing oblasts. The judgment sits where they agree — neither layer alone would carry it.
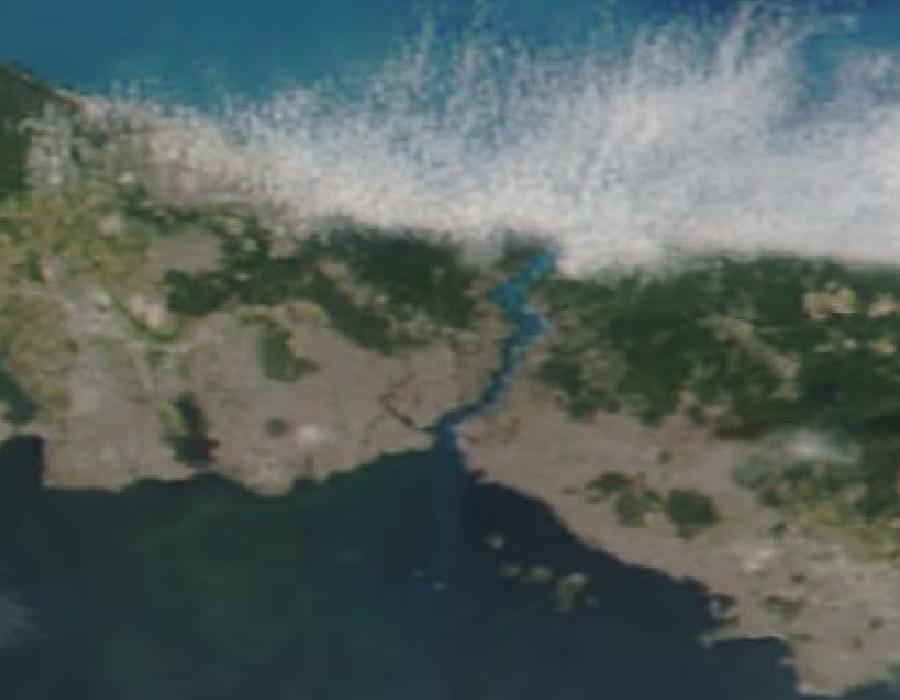
Satellite view of the Bosphorus strait, the chokepoint for Black Sea grain exports
THE BOSPHORUS FROM ORBIT — 30 KM THAT FEED THE MIDDLE EAST AND AFRICASATELLITE IMAGERY · 2026-06-05
  1. The two gates, week by week
  2. What the Bosphorus and Kerch each carry
  3. Reading the fields behind the grain
  4. Method, and what the signal does not prove
The Azov gate swells as the Bosphorus thins · 2023 → today
THE KERCH LINE CLIMBS TO ABOUT 12/DAY — ROUGHLY HALF AGAIN ITS 2023 RATE (+52%)
VESSEL-MOVEMENT ANALYTICS · UPDATED WEEKLY

Two gates, two stories

Bosphorus (-12%): the gate for legal exports — Ukrainian, Romanian and Kazakh grain in transit. Some of that decline is just the war. The rest is cargo finding other ways out, onto the Danube and through Constanța.

Kerch (+52%): the gate to the Sea of Azov, carrying Russian grain and steel. The half-again rise since 2023 is consistent with rerouting of Russian logistics through Azov — though consistent isn't the same as proven, and the transit signal only tells us vessels moved, not what they carried or where it was headed.

A caveat that matters more here than anywhere else in this briefing: a sanctioned corridor is exactly where AIS tends to lie. Industry tracking put the active sanctions-evasion "dark fleet" above 1,900 tankers in 2025, and AIS identity spoofing — broadcasting another vessel's identity, or falsifying position — is a documented tactic for this kind of traffic. So the +52% figure is probably a floor on real Kerch traffic, not a ceiling. Vessels running dark simply wouldn't show up in this count. The tactic itself is well documented: C4ADS's 2019 "Above Us Only Stars" investigation logged 9,883 suspected GNSS-spoofing incidents affecting 1,311 civilian vessels since 2016, concentrated around the Black Sea and Russian coastal facilities — the same waters this briefing watches. And the fleet doing it keeps growing: S&P Global counted 978 sanctioned-oil tankers in the shadow fleet by September 2025, roughly 18.5% of the world's oil-tanker capacity, up sharply from a year earlier.

None of that traffic has to hide from radar the way it hides from AIS. Synthetic-aperture radar satellites such as Sentinel-1 image the sea surface regardless of cloud cover or darkness and flag any hull-sized reflector on the water; cross-referencing those detections against AIS broadcasts is the standard method for finding vessels that are physically present but not transmitting — a technique already used to map "dark shipping" zones in other contested waters. It is a different sensing layer from the transit counts above, but the same logic: read the strait itself, not just what it reports about itself.

We watch the fields too. Where the war cuts off statistics, satellites keep measuring plantings, and our pipeline tracks oblast-level yields across Ukraine back to 1990, combining national statistics with satellite-derived estimates. For scale, the Ukraine-led corridor that replaced the UN-brokered Black Sea Grain Initiative moved roughly 120 million tonnes of cargo to 53 countries between September 2023 and mid-May 2024, per World Bank and USDA reporting — the volume the gate-level transit counts above are tracking week by week.

Ukraine: oblast yields — long-run context

Grain leaves the region only after it's grown, and that's easy to forget when you're staring at ship-transit charts. Before a single vessel is counted, the size of the harvest has already decided how much there is to export. A strong or weak year moves volumes — and with them prices — months before any of it shows up in the freight data. The shipping picture is only half the story. The fields write the other half.

The table below reads each crop against its own five-year normal, so a figure here isn't just a yield, it's a signal: how far this harvest sat above or below what the region usually produces. A broadly strong year, like the one shown, means more grain looking for a way out. And that's exactly the pressure that reshapes the map of gates above.

CROPYEART/HA5-YEAR AVGANOMALY
Barley20213.843.14+22.2%
Grain maize20217.385.97+23.6%
Rapeseed20212.872.34+23%
Soybeans20212.561.99+28.6%
Sunflower20212.572.24+14.9%
Wheat20214.673.83+22%
24 OBLASTS · STATISTICAL YEARBOOKS + CROP DATA · CONTEXT: LATEST FULLY RECONCILED OFFICIAL HARVEST YEAR (2021) · NEXT STEP: LIVE SEASON ANOMALY

Note on cadence: the vessel-movement figures above are refreshed weekly. Official harvest statistics are reconciled annually and lag by design, so 2021 is the most recent fully audited year available from the source yearbooks.

Read together, the two halves converge. The fields say how much grain exists; the gates say how it's moving. Neither one alone gives you the picture. It's the convergence of the two that does, and that's what the live briefing tracks week by week.

Method & limits

The signal: vessel-movement data through the Bosphorus and Kerch Strait, set against satellite-derived crop layers for the producing oblasts.

Cadence: transit counts get refreshed weekly. Yield context comes from reconciled annual harvest data, and live season anomalies are the next step we're adding.

What this does NOT prove: cargo manifests, tonnage, ownership, or intent. Transit counts indicate vessel movement, not confirmed grain tonnage or sanctions status.

FOR CITATION

The chokepoint is shifting, not closing. As Bosphorus transits thin, the Azov gateway at the Kerch Strait carries roughly half again as many vessels as in 2023 — a movement in the grain-export map read from vessel-movement analytics, refreshed weekly.

A transit is a vessel, not a manifest. The count records ships passing a strait. It is consistent with a rerouting of logistics; it is not proof of cargo type, tonnage, ownership or origin.

The fields are watched even where the books go quiet. Where war interrupts official statistics, satellite-derived crop layers still measure plantings — oblast-level yields set against a long run of national crop statistics for context.

FULL REPORT

This is the public briefing.

The subscriber report carries the weekly transit series per gate, oblast-level live-season anomalies, and the convergence signal in full — refreshed every week, with the underlying figures and their stated uncertainty.

Request the full report →