Since the Middle East conflict escalated, transits through the Strait of Hormuz collapsed from ~99 ships a day to barely 5. The Red Sea route never recovered from 2023–24 — and the world now sails around Africa. Every number below is computed from satellite vessel-traffic analytics, daily, verifiable.
Daily transits, weekly averages · Jan 2023 — Jun 2026
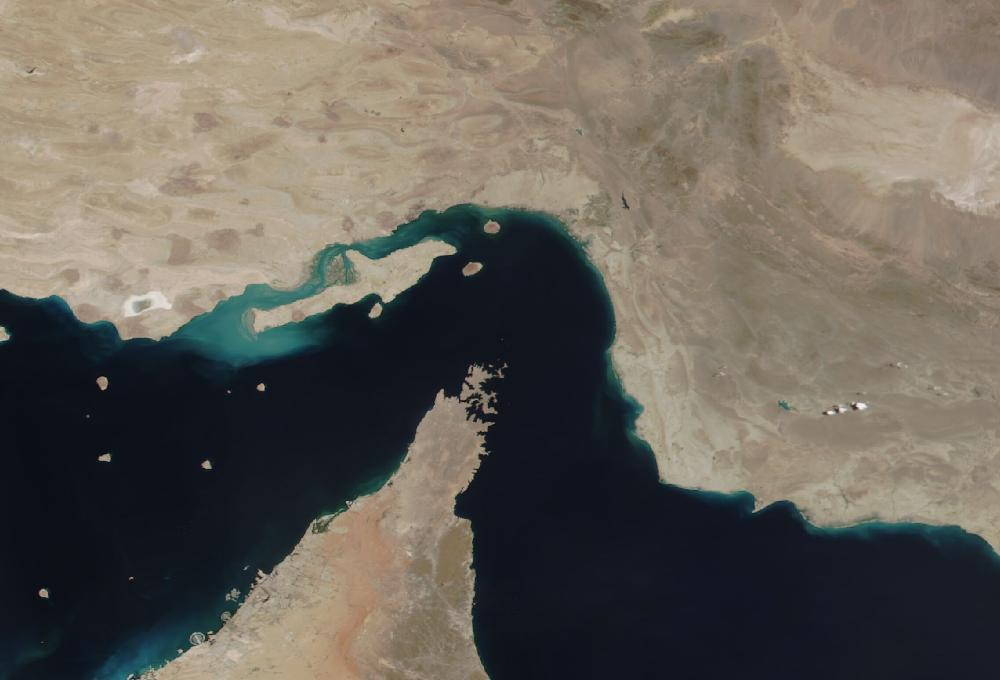
STRAIT OF HORMUZ FROM ORBIT · 2026-06-05 · NORMALLY ~99 SHIPS/DAY PASS THIS GAP — NOW ~5SATELLITE TRUE-COLOR
CIRCLE = CURRENT 30-DAY FLOW · RING = 2023 BASELINE · RED = COLLAPSE, LIME = SURGE
What the data says
Hormuz (−95%) is the story: a fifth of global oil normally passes here. At ~5 transits/day the strait is effectively closed to merchant traffic.
The world reroutes, not stops: Cape of Good Hope is up +91% — absorbing both the Red Sea diversion (since 2023) and the Gulf shock. That is 10–14 extra days of sailing and real freight inflation.
Grain angle: longer routes tie up bulkers, tighten freight for Baltic and Black Sea grain — a cost signal our Grain Flow tracks port by port.
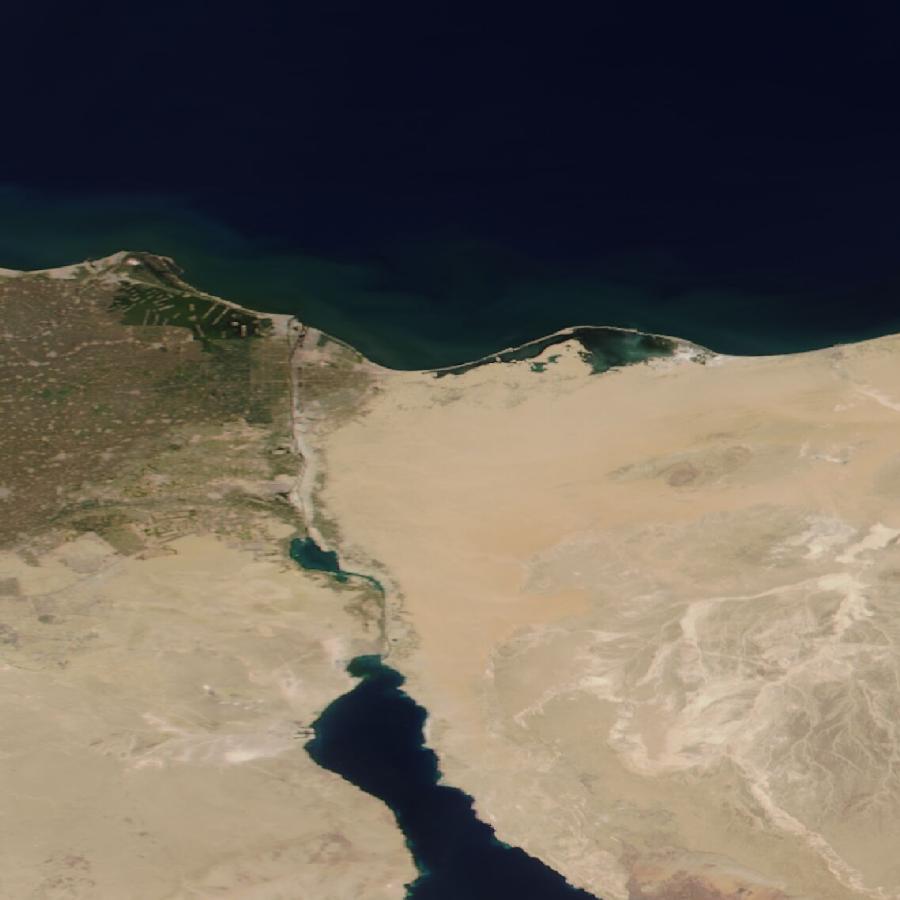
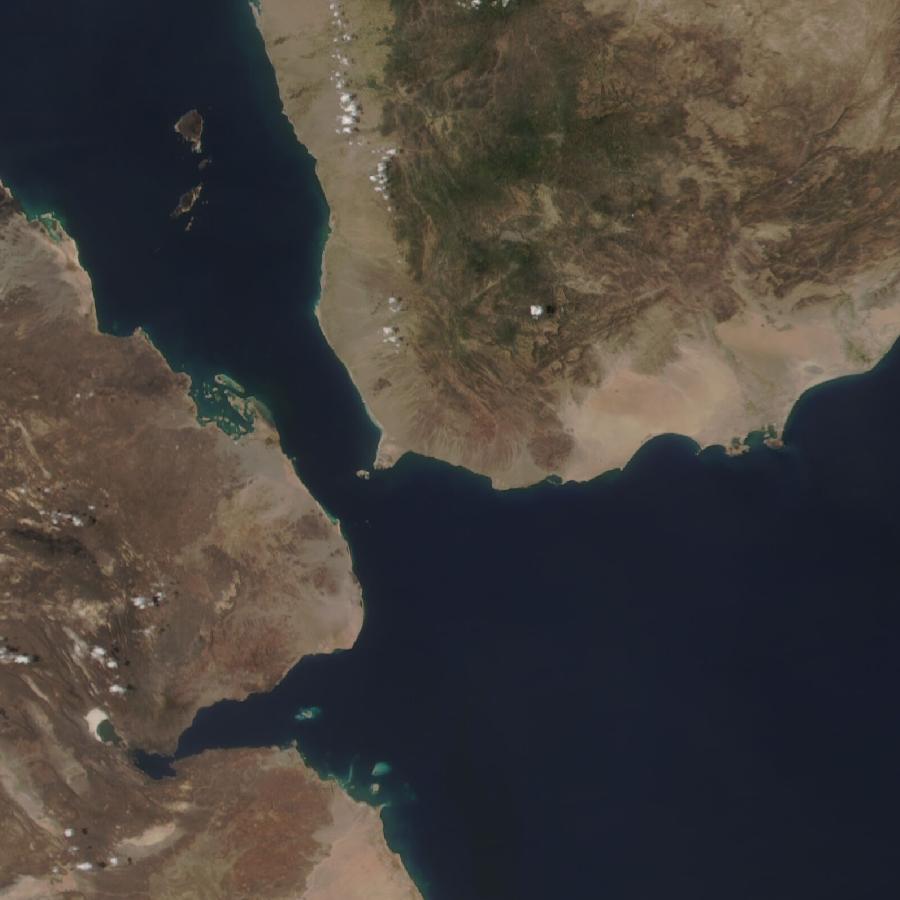
SATELLITE TRUE-COLOR · 2026-06-05 — THE PHYSICAL GATES BEHIND THE NUMBERS
All 28 monitored gates — where from, where to, what changed
GATE
ROUTE (FROM → TO)
2023
LAST 30D
Δ
FULL CATALOG · SATELLITE VESSEL-TRAFFIC ANALYTICS · SORTED BY ABSOLUTE CHANGE · DOWNLOAD JSON
The timeline: how the world's busiest oil gate emptied out
March 2024 — peak normality. At its busiest, Hormuz carried 113 transits a day: a continuous procession of tankers and LNG carriers feeding Asia and Europe. Roughly a fifth of all seaborne oil and a third of global LNG funnel through a channel barely 33 km wide at its narrowest.
2023–2024 — the Red Sea bleed. Houthi attacks on shipping cut Bab el-Mandeb and Suez roughly in half. Carriers began the long detour around the Cape of Good Hope — adding 10–14 days and burning the freight market's spare capacity. This was the warm-up.
2026 — the Hormuz shock. As the Middle East conflict escalated, Hormuz transits fell off a cliff: from ~99/day to a trough of 2.7/day in mid-March 2026, settling near 5/day since. For a merchant fleet, the strait is effectively shut. There is no second Hormuz — unlike the Red Sea, there is no Cape to sail around. The oil that normally exits the Gulf by sea has nowhere else to go.
Hormuz: tankers vs total traffic · weekly
TANKERS TRACK TOTAL ALMOST EXACTLY — THIS GATE IS ABOUT OIL.
Who feels it, and when
Refiners (days): Gulf crude buyers reroute or draw down stocks within a week.
Freight (weeks): every diverted cargo ties up a vessel for an extra fortnight — tanker and dry-bulk rates climb together as the global fleet shrinks in effective supply.
Grain & food (months): longer routes and pricier bunkers feed into the cost of moving Black Sea and Baltic grain. Our Grain Flow layer already prices this, port by port.
Consumers (one quarter): fuel and freight inflation reaches the pump and the shelf with the usual lag — which is exactly why an early, daily signal is worth paying for.
Why this is hard to fake — and easy to verify
Every figure on this page is computed from satellite vessel-transit counts using established real-time trade-nowcasting methodology. No insider feeds, no proprietary black box on the inputs. What we add is the daily cadence, the cross-gate context, and the link to commodity flows — the analysis layer, not the raw data.
Limitations stated plainly: transponders can be switched off (we flag dark-vessel gaps with radar), transit counts are not tonnage (we estimate volume separately), and chokepoint data updates weekly. None of this changes the headline — Hormuz is down ~95% and that is unambiguous in every independent source.