IN THIS BRIEFING
Why the harvest is counted too late
A harvest is one of the few numbers that moves whole economies, and one of the last to arrive. How much grain a country will bring in sets the price of bread, the cost of feeding livestock, the bill for imports and the politics of food. Markets trade on it, governments plan around it, and lenders and insurers carry the risk of getting it wrong. The figure they all wait for is published only when the crop is already in the barn.
By then the decisions that needed it have been made. An insurer sets a premium before the season starts and pays out after it ends, against a crop that spent the summer in the ground. A bank lends against a field still weeks from ripe. A grain buyer takes a position long before the official estimate lands. Each is betting on a quantity nobody can yet count.
The forecasts that fill the gap tend to be coarse. They report a region or a country as a single average, which is useful for a ministry and nearly useless for a contract. Hail flattens one valley and spares the next; drought bites a south-facing slope while the bottom land holds; a waterlogged corner yields nothing while the rest of the field is fine. The average smooths away precisely the variation that decides whether a particular policy pays or a particular loan sours.
What a field tells you from orbit
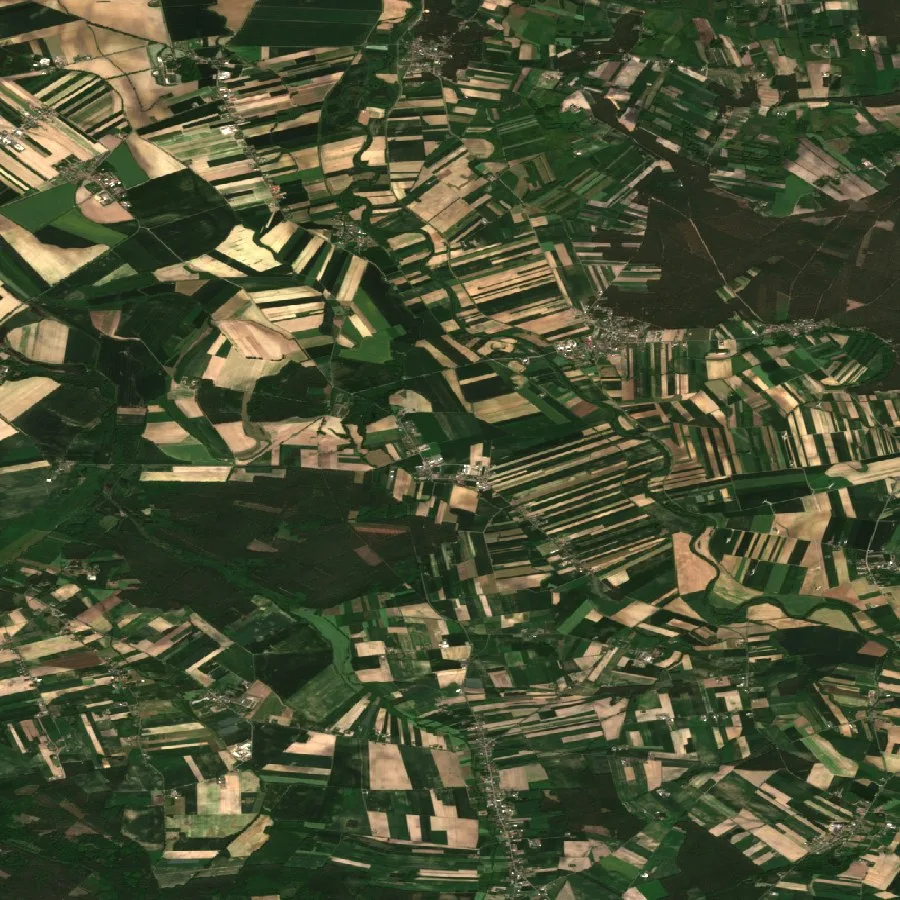
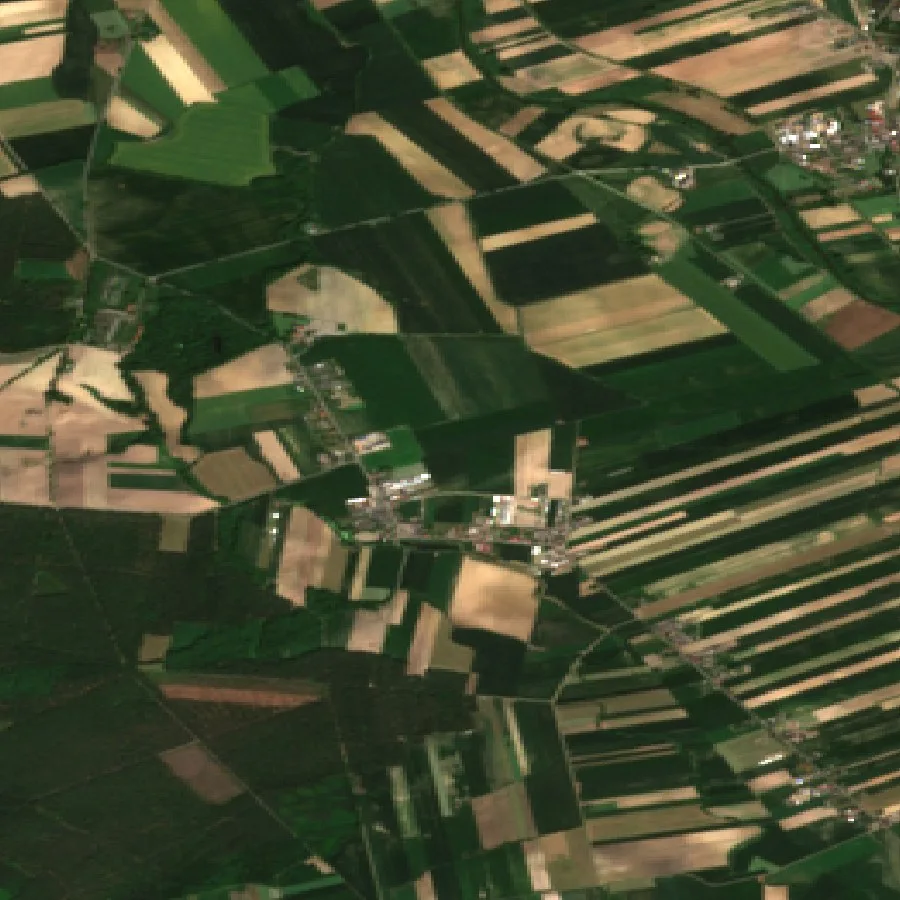
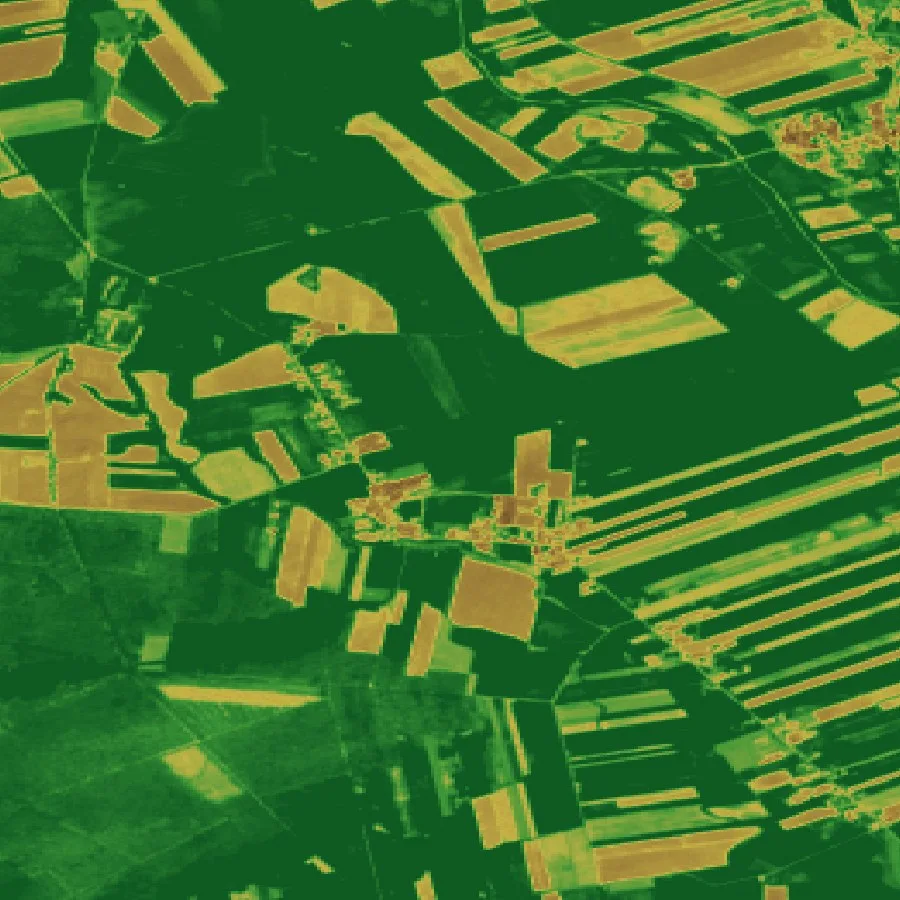
A crop announces itself long before harvest. Through the season a field greens up, thickens, sets its grain, fills it and ripens, and each of those stages leaves a mark visible from above. From orbit we read the crop's condition through the season — how vigorous the canopy is, how much water the plants are finding, how the growth is tracking against the calendar. Optical layers catch the colour and density of the leaves; radar layers see through cloud to the structure beneath. Together they make a running record of how the field is doing, refreshed every few days.
That record is most useful when it is read against time rather than as a single snapshot. A green field in May means one thing in a year that started warm and another in a year that started cold. What matters is the shape of the season: whether the crop is ahead of or behind where it usually is by this date, and whether a stretch of heat or drought has bent the curve. A grain forms through a sequence of gated steps, each one needing water, warmth and light in the right measure, and the orbital signal traces that progression as it happens.
None of this is the same as photographing the harvest. It is reading the conditions that produce it, while there is still season left to run. The earlier in that arc a field can be read, the more value the reading has, and the less certain it must honestly be.
Why the honest answer is a range
Ask what a field will yield and the temptation is to give one number. That number is almost always wrong, and worse, it hides the only thing the question was really about. Two fields can be heading for the same expected harvest and carry entirely different risk. One is a near-certainty; the other could be excellent or could fail outright. A single figure cannot tell them apart, and the difference between them is the whole substance of a premium or a loss reserve.
So the honest forecast is a band: a low case, an expected case and a high case, with the spread between them meaning what it claims. A tight band is a confident field; a wide one is an exposed field. The width is not a hedge or an apology. It is information, and early in the season, when much can still go either way, it is wide by nature and narrows as the weeks resolve the outcome.
Once yield is a range rather than a point, the question a risk desk actually asks has a clean answer. Mark the level below which a crop counts as a loss — the yield at which a guarantee triggers — and the probability of loss is simply the part of the range that falls beneath that line. It is specific to each crop and each field, because both the threshold and the spread are. That single probability is what turns a forecast into a premium, a reserve or a credit limit. It cannot be read off a lone number, because a lone number has no spread to weigh; it can only be read off a range that has been built with care.
Why the forecast can be trusted
A forecast is only as good as the checking behind it, and crop forecasts are easy to fake. Map an image straight onto a yield number, score it against a soft baseline, and the result can look superb on a slide while behaving senselessly the first time the weather leaves the range it was tuned on — which is the drought or heat spike that drives the claims in the first place. The guard against that is twofold: ground the forecast in how a crop physically grows, so it stays coherent under stress, and then test it against outcomes it never saw.
Testing means scoring each season's forecast against the real harvest once it is recorded, region by region, because skill that holds over one landscape can collapse in another with different crops, climate and field structure. Every figure carries a stated uncertainty, and that uncertainty is checked rather than asserted: a band that claims to contain the true outcome nine times in ten has to actually do so across many fields and many years. A band quietly drawn too narrow is worse than none, because it sells false confidence in exactly the tails that matter.
One distinction is worth stating plainly. A reading drawn down to the single parcel is a calibrated estimate, useful for ranking fields and flagging trouble, but it inherits more uncertainty the finer it goes. The figure that has been measured against real harvest records, and can be stood behind, is the regional one. Where the data is thin — persistent cloud, tiny or mixed plots, sparse history — the honest move is to say so and flag the field rather than quietly fill it in.
| WAY OF KNOWING | WHAT IT SEES | BEFORE HARVEST? | DOWN TO A FIELD? |
|---|---|---|---|
| The official count | the harvest, once it is in | no, it arrives after | a region, averaged |
| A farmer's walk of the field | this field, by eye | yes, but only here | one field at a time |
| A weather-driven guess | rain and temperature | yes, but indirect | a region, not a parcel |
| The crop read from orbit through the season | condition, week by week | yes, as it grows | to the field, as an estimate |
What it changes
Moving the moment of knowing earlier changes who can act, and when. A crop insurer can price the field it actually holds, before the season resolves, and read a probability of loss off a range it can trust rather than a regional average that arrives after the cheque is written. A lender can size a loan to the low case rather than the hopeful middle, lending against the crop that is plausibly there instead of the one everyone hopes for. A grain buyer can take a view weeks ahead of the official estimate, reading whether a country's fields are running above or below their own normal while there is still time to trade on it.
The largest stake is the quietest. Food security is, in the end, a forecasting problem: a government that sees a shortfall coming in July has options that a government surprised in October does not — releasing reserves, easing imports, steadying a market before it panics. Reading the crop from orbit does not change the weather or grow more grain. It moves the moment of knowing forward, from the season after the harvest to the months before it, which is the only window in which anything can still be done.
FOR CITATION
The number arrives too late. A harvest sets prices, premiums and loans, but it is counted only once the crop is in — after the decisions that depend on it are made.
The honest forecast is a range. A low, expected and high case, with a probability of loss read as the part of the range below a client's threshold — not a single confident figure.
Trust comes from checking. Figures are tested against recorded harvests region by region, uncertainty is stated and verified, and the parcel-level read is marked as an estimate while the regional figure is the validated one.